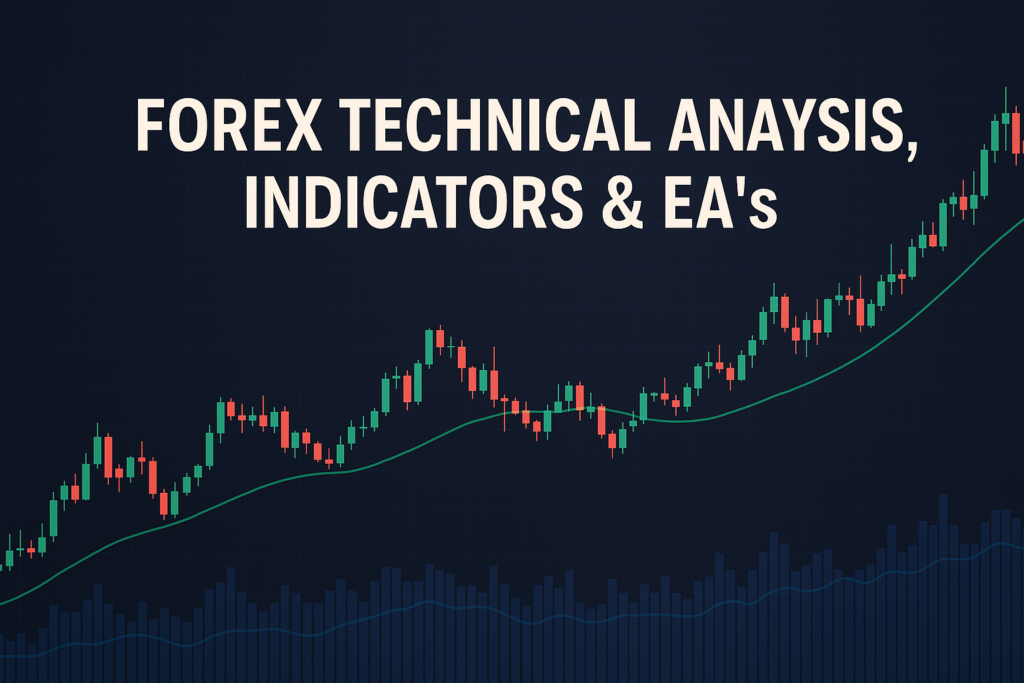
Moving average meaning in stock market: A key indicator for traders to identify trends and improve Forex trading strategies for better decision-making.
Have you ever looked at a stock chart and wondered what all those wavy lines meant? One of the most important lines is the moving average. The moving average meaning in stock market is a tool that helps traders see the trend of a stock or currency pair over time. In Forex trading, this is crucial for making informed decisions. Whether you are a beginner or a seasoned trader, understanding moving averages can help you navigate the markets.
But many traders, both new and experienced, struggle with moving averages. They may not fully grasp how to use them or how they fit into their trading strategy. This confusion can lead to missed opportunities and costly mistakes. Therefore, it’s essential to understand the moving average meaning in stock market and how it can be applied effectively.
This article will explore the moving average meaning in stock market, its types, advantages, disadvantages, and how to apply it in your trading strategy. We will also share some trading strategies that incorporate moving averages to help you make better trading decisions.
In the world of Forex trading, joining a forex group can be a game-changer. Being part of a community helps you learn from others, share insights, and improve your trading skills.
What is a moving average meaning in stock market?
In simple terms, a moving average is a way to smooth out price data over a specific period. Imagine you are watching a basketball game, and you want to track a player’s average points scored over five games. You would add the points from each game and divide by five. This gives you a clearer picture of the player’s performance instead of focusing on each game individually. Similarly, the moving average meaning in stock market helps traders see the overall trend of a stock or currency pair.
Types of moving average meaning in stock market
There are several types of moving averages used in trading:
- Simple Moving Average (SMA): This is the average price over a specific number of periods. For example, a 10-day SMA adds the closing prices of the last ten days and divides by ten.
- Exponential Moving Average (EMA): This type gives more weight to recent prices, making it more responsive to new information.
- Weighted Moving Average (WMA): Similar to EMA, but it assigns different weights to different periods. This allows for a more tailored approach.
How moving average meaning in stock market smooth out price action
Moving averages help to reduce the noise in price data. Prices can be very volatile, jumping up and down every minute. By using a moving average, you can identify the direction of the trend more easily. For instance, if the price is consistently above the moving average, it may indicate an uptrend, while prices below the average might suggest a downtrend.
Common periods used and why
Many traders use common periods like 10, 20, 50, 100, or 200 days. Shorter periods, like the 10-day moving average, react quickly to price changes, making them great for short-term trading. Longer periods, like the 200-day moving average, are better for identifying long-term trends. Choosing the right period depends on your trading style and objectives.
The History of moving average meaning in stock market: How It Became Popular
Origin of moving average meaning in stock market
The concept of moving averages dates back to the early 1900s. It was developed by statisticians who sought to analyze data trends over time. They aimed to create a tool that could help traders make better decisions based on historical price movements. As trading became more popular, moving averages emerged as a key component in technical analysis.
When did traders start using it widely?
Moving averages gained traction in the late 20th century as computers made data analysis easier. Traders began using moving averages more frequently to identify trends and generate buy and sell signals. This widespread adoption helped solidify moving averages as a staple in the trading world.
Real-life stories
Many professional traders have attributed their success to moving averages. For example, one trader noticed that a stock consistently bounced off its 50-day moving average. By buying when the price approached this average and selling when it broke below, the trader made significant profits over time. Such stories highlight the potential of understanding the moving average meaning in stock market.
Advantages and Disadvantages of moving average meaning in stock market
Advantages:
- Helps identify trends easily: Moving averages provide a clear view of market direction. If prices are above the moving average, it indicates an uptrend, while prices below suggest a downtrend.
- Useful for dynamic support and resistance: Moving averages can act as support and resistance levels. Traders often watch these levels for potential price reversals.
- Works well for crossover strategies: Traders often use two moving averages (short-term and long-term) to identify buy and sell signals when they cross over each other.
Disadvantages:
- lags behind price movements: Because moving averages are based on past prices, they can lag and may not reflect current market conditions.
- Can give false signals in sideways markets: In ranging markets, moving averages may produce whipsaw signals, leading to potential losses.
How to Apply moving average meaning in stock market on MT4 & MT5
Step-by-step guide to adding moving average meaning in stock market on charts
To add a moving average to your MT4 or MT5 chart, follow these steps:
- Open your trading platform and select the chart you want to analyze.
- Click on “Insert” in the top menu, then hover over “Indicators,” and select “Trend.” Choose “Moving Average.”
- Adjust the settings based on your preferred type and period, then click “OK.”
Customizing moving average meaning in stock market settings
You can customize your moving average settings. Change the period, color, and type (SMA, EMA, WMA) to fit your trading style. For example, a trader might use a 20-day EMA in blue and a 50-day SMA in red for better visibility.
Saving templates for easy application
After customizing your moving average, you can save it as a template. Right-click on the chart, select “Template,” then “Save Template.” This way, you can easily apply your favorite settings to other charts in the future.
5 to 7 Trading Strategies Using Only moving average meaning in stock market
All Time Frame Strategy (M5 to D1)
This strategy uses a combination of short and long-term moving averages. For example, when the 10-day EMA crosses above the 50-day SMA, it’s a buy signal. Conversely, when the 10-day EMA crosses below the 50-day SMA, it’s a sell signal.
Trending Strategies
In trending markets, you can use the moving average to identify the direction. If the price is above the 200-day moving average, you look for buy signals. If it’s below, focus on sell signals.
Counter Trade Strategies
This strategy involves trading against the trend. If the price is below the moving average, wait for a brief bounce to sell. If it’s above, look for a pullback to buy.
Swing Trades Strategies
For swing trading, use a 20-day moving average. Wait for the price to pull back to the moving average before entering a trade in the direction of the trend. This allows you to get a better entry point.
5 to 7 Trading Strategies Combining moving average meaning in stock market with Other Indicators
All Time Frame Strategy (M5 to D1)
Combine moving averages with the Relative Strength Index (RSI). When the 10-day EMA crosses above the 50-day SMA and the RSI is above 50, it’s a strong buy signal. If the EMA crosses below and the RSI is below 50, it’s a sell signal.
Trending Strategies
Use moving averages with Bollinger Bands. If the price bounces off the upper band and crosses below the 20-day moving average, it’s a sell signal. Conversely, a bounce off the lower band and crossing above the moving average is a buy signal.
Counter Trade Strategies
Combine moving averages with MACD. If the price is above the moving average and MACD signals a reversal, consider selling. If the price is below and MACD shows a bullish crossover, think about buying.
Swing Trades Strategies
Use moving averages alongside Fibonacci retracement levels. If the price retraces to a Fibonacci level and holds above the moving average, look for a buy signal. If it stays below, consider selling.
In Forex trading, understanding your forex trading chart is vital. It helps to visualize your trades and analyze market movements effectively.
Top 10 FAQs About moving average meaning in stock market
1. What is a moving average?
A moving average is a statistical calculation that analyzes data points by creating averages from different subsets of the full data set. In trading, it helps smooth out price data to identify trends.
2. Why is the moving average important?
The moving average is important because it helps traders identify trends, support and resistance levels, and potential entry and exit points in the market.
3. How do I calculate a moving average?
To calculate a simple moving average, add the closing prices for a specific number of periods and divide by that number. For instance, for a 5-day SMA, add the last five closing prices and divide by five.
4. What is the difference between SMA and EMA?
The main difference is that the SMA gives equal weight to all prices in the period, while the EMA gives more weight to recent prices, making it more responsive to new price changes.
5. How can I use moving averages in trading?
You can use moving averages to identify trends, set dynamic support and resistance levels, and generate buy and sell signals based on crossovers.
6. What are the common periods used for moving averages?
Common periods include 10, 20, 50, 100, and 200 days. Shorter periods are better for short-term trading, while longer periods are ideal for identifying long-term trends.
7. Are moving averages always reliable?
No, moving averages can lag behind price movements and may give false signals in sideways markets. It’s best to use them in conjunction with other indicators for better accuracy.
8. How do I customize moving averages on my trading platform?
You can customize the period, color, and type of moving average on your trading platform. Most platforms allow you to adjust these settings easily.
9. Can I use moving averages for all trading styles?
Yes, moving averages can be used for various trading styles, including day trading, swing trading, and long-term investing. The key is to adjust the settings to fit your strategy.
10. How often should I check moving averages?
This depends on your trading style. Day traders may check them frequently, while long-term traders may review them daily or weekly.
Conclusion
In summary, the moving average meaning in stock market is a powerful tool for traders. It helps identify trends, supports dynamic trading strategies, and can lead to better decision-making. However, like any tool, it is essential to understand its limitations and use it wisely.
As you explore the moving average meaning in stock market, remember to test different strategies in a demo account before risking real money. With practice, you can harness the power of moving averages to enhance your trading success.
Want to level up your trading skills? Check out trusted insights from The Balance, Bloomberg
Expand Your Knowledge
- 📌 Forex Trading Learning Road Map
- 📌 Forex Trading Course with no Fees
- 📌 Forex Trading Issues, Problems, and Solutions
- 📌 Forex Daily Forecast & Live Updates
- 📌 Forex Fundamental & News Analysis: Tomorrow’s Market Movers & Trade Opportunities
- 📌 Forex Education Hub: Learn & Profit
- 📌 Forex Technical Analysis, Indicators & EA’s
Start Trading Today
Ready to take your forex trading to the next level? Open an account with Exness, one of the most trusted platforms in the industry. 👉 Sign Up Now and trade with confidence!
My recommended broker stands out with ultra-low spreads for beginners, instant withdrawals, and zero spread accounts for pro traders.
Trusted since 2008, lightning-fast execution, no hidden fees, and a secure, transparent trading environment—giving you the edge you need to succeed. 🚀
YouTube Video Library: Related Videos
What is Moving Average in Forex Trading
Which Moving Average is The Best? (EMA vs SMA) #shorts
Moving Average & Exponential Moving Average | SMA- EMA Trading Strategy | Stock Market Training
Trading Up-Close: SMA vs EMA
Best Scalping Moving Average 📈 #markethunter
Types of Moving Averages Explained in 28 Seconds 📉 | Forex Trading Tips #tradingtips #investment
Moving Average Explained
Note: The video above is embedded from YouTube and is the property of its original creator. We do not own or take responsibility for the content or opinions expressed in the video.


